In this era of big data, the problem may not be collecting and storing data but how to analyze data. Today, most companies know the best strategies to collect the enormous amount of data they generate on a daily basis. Others also access data from secondary sources like other companies and collect this data for their databases.
Data analysis relies on the tools and skills applied to it. Further, the intended use will also determine what needs to be analyzed. One of the steps in data analysis is data visualization through the use of diagrams, charts, graphs and any other visualization tools. With enormous amounts of data, special tools must be used. And this is where Grafana and Kibana come in. Both are helpful open-source tools that can be applied in many instances.

What Are Grafana and Kibana?
Before understanding the differences, we need to know what each of these tools is. Grafana is a useful tool that replaces Graphite-Web to visually analyze different types of data. It is an open-source tool that is applied in different organizations to take care of data visualization and metrics analytics.
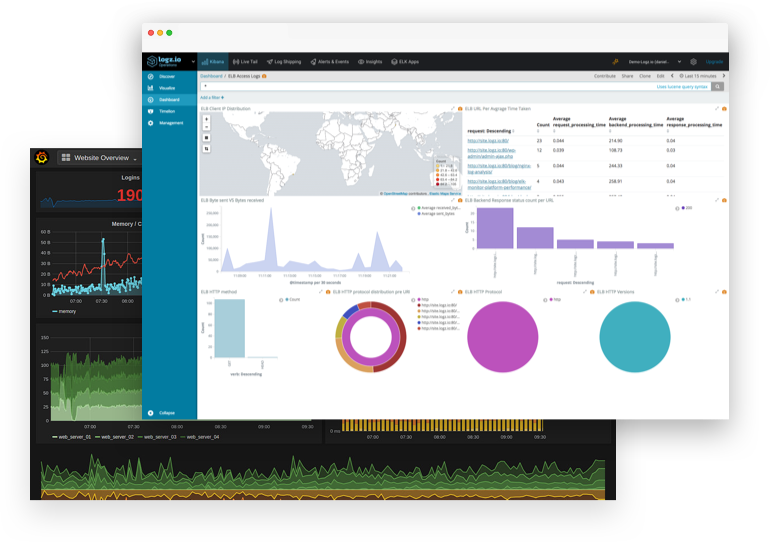
Kibana is also an open-source tool for handling logs. According to experts from ActiveWizards data engineering company, it is one of the most popular in the world. Simply said, Kibana deals with data analysis through querying and then displaying results in various ways like charts and graphs.
So, what are the differences between these two tools? Here is what you need to know.
How to Start
Before starting, installation of any of these open-source visualization tools is necessary. Kibana works together with the Elasticsearch database, which should already be installed on your computer. It is easy to install and has different installation options. Grafana is also easy to set up but uses a different configuration method through .uni files.
The Purpose of the Tools
As mentioned during the descriptions of each, the purpose of the two differ. Starting with Kibana, its main purpose is to deal with logs. You can query the data to get the results that you intend, which makes it much simpler. The best part is that the data will be displayed in a convenient way. On the other hand, Grafana handles the metrics and provides results in a visual mode. One thing to know is that this method will not allow you to query but uses different query editors depending on where it is used.
The Data Source
Both work with a separate data source. Kibana is confined to Elasticsearch as a data source only while Grafana is open to many sources including MySQL, Elasticsearch and many others. Therefore, you already know which one is better for your needs depending on the resources that you have.
Authentication and Access
Both of these tools are open source, which means that the public can download them for free. Each has authentication mechanisms. For Kibana, you need separate control and authentication measures like search guard and X-Pack add-ons. On the other hand, Grafana is bundled with internal control and authentication measures.
Prashant Chaudhary
An android fan and A Computer Engineer who fell in love with the world of Internet Marketing. Worked on different SEO techniques for small to large Internet properties at Initial days of my Career. I am in love with my passion for Blogging and running several blogs in variety of category.


